import pandas as pd
from sklearn import preprocessing
from sklearn import tree
from sklearn.datasets import load_iris  # 花瓣种类
# 加载数据
iris = load_iris()
dir(iris) # iris包含的内容有哪些 如果不懂某些方法 可用 help(iris)
['DESCR', 'data', 'feature_names', 'filename', 'target', 'target_names']
iris_feature_names = iris.feature_names  # 特征名
iris_features = iris.data  # 数据集内容
iris_target_name = iris.target_names
iris_target = iris.target
iris_feature_names # 特征名 花瓣长度高度 花萼长度宽度
结果:
['sepal length (cm)',
 'sepal width (cm)',
 'petal length (cm)',
'petal width (cm)']iris_features[:5,:] # 查看前5行
结果:
array([[5.1, 3.5, 1.4, 0.2],
       [4.9, 3. , 1.4, 0.2],
       [4.7, 3.2, 1.3, 0.2],
       [4.6, 3.1, 1.5, 0.2],
       [5. , 3.6, 1.4, 0.2]])
iris_target # 查看结果 用 0 1 2 表示不同的花
结果
array([0, 0, 0, 0, 0, 0, 0, 0, 0, 0, 0, 0, 0, 0, 0, 0, 0, 0, 0, 0, 0, 0,
       0, 0, 0, 0, 0, 0, 0, 0, 0, 0, 0, 0, 0, 0, 0, 0, 0, 0, 0, 0, 0, 0,
       0, 0, 0, 0, 0, 0, 1, 1, 1, 1, 1, 1, 1, 1, 1, 1, 1, 1, 1, 1, 1, 1,
       1, 1, 1, 1, 1, 1, 1, 1, 1, 1, 1, 1, 1, 1, 1, 1, 1, 1, 1, 1, 1, 1,
       1, 1, 1, 1, 1, 1, 1, 1, 1, 1, 1, 1, 2, 2, 2, 2, 2, 2, 2, 2, 2, 2,
       2, 2, 2, 2, 2, 2, 2, 2, 2, 2, 2, 2, 2, 2, 2, 2, 2, 2, 2, 2, 2, 2,
2, 2, 2, 2, 2, 2, 2, 2, 2, 2, 2, 2, 2, 2, 2, 2, 2, 2])iris_features.shape # 查看维度
(150, 4)
构建模型 分类器
clf = tree.DecisionTreeClassifier(max_depth=4)
clf = clf.fit(iris_features,iris_target)
clf # 查看这个决策树的分类器
结果
DecisionTreeClassifier(ccp_alpha=0.0, class_weight=None, criterion='gini',
                       max_depth=4, max_features=None, max_leaf_nodes=None,
                       min_impurity_decrease=0.0, min_impurity_split=None,
                       min_samples_leaf=1, min_samples_split=2,
                       min_weight_fraction_leaf=0.0, presort='deprecated',
                       random_state=None, splitter='best')
可视化
import pydotplus
from IPython.display import Image,display
dot_data = tree.export_graphviz(clf,
                                out_file=None,
                                feature_names = iris_feature_names,
                                class_names = iris_target_name,
                                filled = True,
                                rounded = True
                               )  # 输出文件 特征 目标 填充颜色
import os
os.environ["PATH"] += os.pathsep + 'C:/Program Files (x86)/Graphviz2.38/bin/'  #注意修改你的路径
graph = pydotplus.graph_from_dot_data(dot_data)
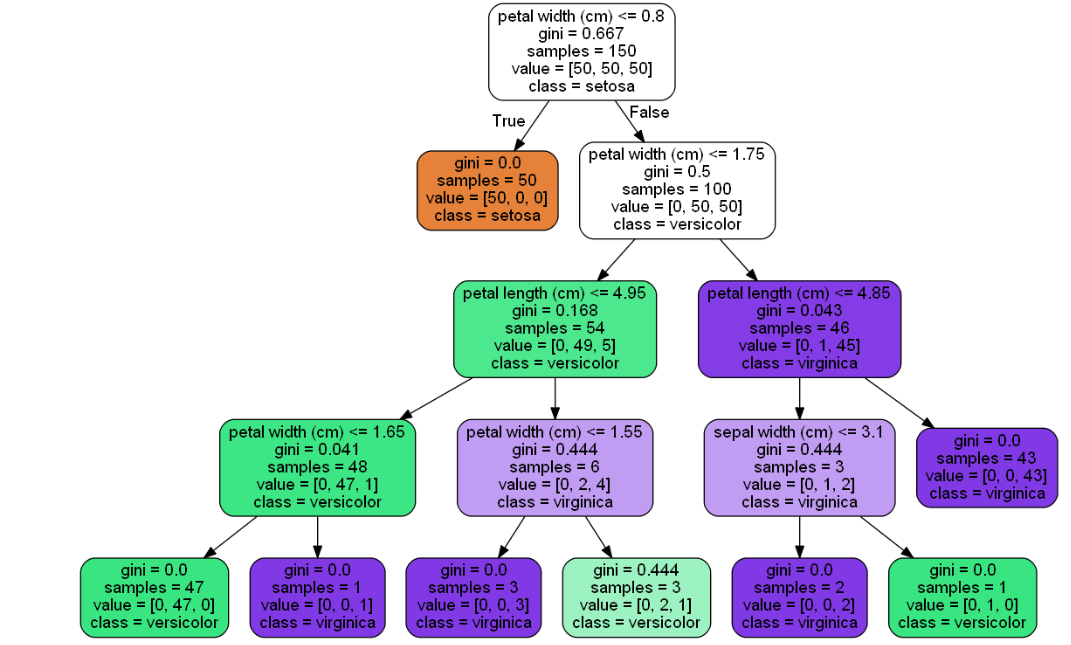
display(Image(graph.create_png()))
小结
连续值的处理:
- 二分法
缺省值处理:
- 样本赋权,权重划分